How to Calculate Cross-Currency Pair Volatility?
How to Calculate Cross-Currency Pair Volatility?
Visit the Mathema Option Pricing System, supporting FX options and structured product pricing and valuation!

In the foreign exchange (FX) market, the US dollar (USD) is the most liquid currency, and exchange rates are typically quoted against the USD (with some exceptions that we will ignore). Any other exchange rate can be derived from these USD-based quotes. For example, the EURCHF exchange rate (one of the exceptions) can be obtained from EURUSD and USDCHF as follows:
You can think of the USD canceling out in these two exchange rates. Note that we could also multiply by USDCHF directly, but the reason for this approach will become clear shortly.
Since we are dealing with volatility and correlation, we focus on the logarithmic returns of the above relationship:
To simplify notation, from now on, when we refer to a currency pair (e.g., EURUSD), we mean its returns.
Using the properties of the variance of the sum of two variables, we can express the volatility of EURCHF (𝜎EURCHF) as a function of the other two exchange rates, EURUSD and USDCHF:
where 𝜌 is the correlation. The correlation (𝜌) can be calculated from historical data of the currency pairs, which is beyond the scope of this discussion. Alternatively, we can use precomputed correlations: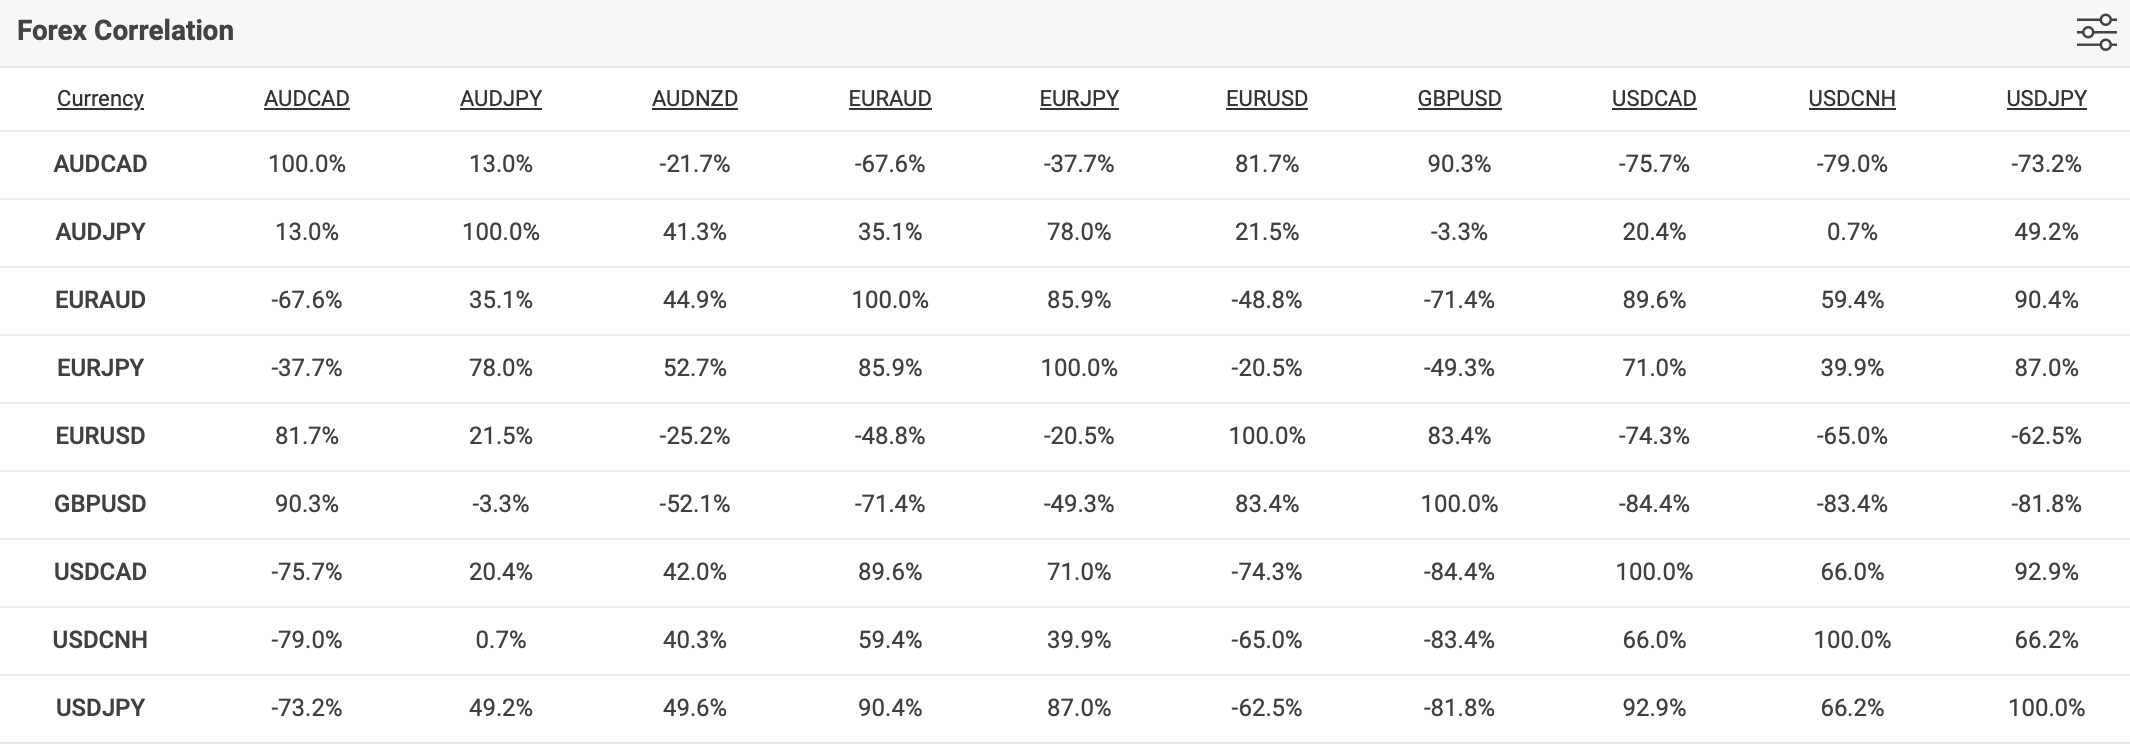
Source: https://www.myfxbook.com/forex-market/correlation
Calculation Example
| Bid | Ask | |
|---|---|---|
| USDCNY | 4.12% | 4.89% |
| EURUSD | 3.54% | 3.91% |
The correlation between USDCNY and EURUSD: -65.0%
Here:
Calculation Results:
| Bid | Ask | |
|---|---|---|
| EURCNY | 6.962% | 8.004% |
Extended Reading - Using Trigonometric Functions to Solve Problems
For those familiar with trigonometry, the above might remind you of the cosine theorem! Indeed, it closely resembles the cosine theorem:
where 𝛼 is the angle formed by 𝑏 and 𝑐.
Note that even though we have treated the cross-exchange rate in this way, we can derive similar expressions for the other two exchange rates under consideration. By identifying terms, we can think of volatility as the sides of a triangle and correlation as the cosine of its angles. This leads to the following graphical representation: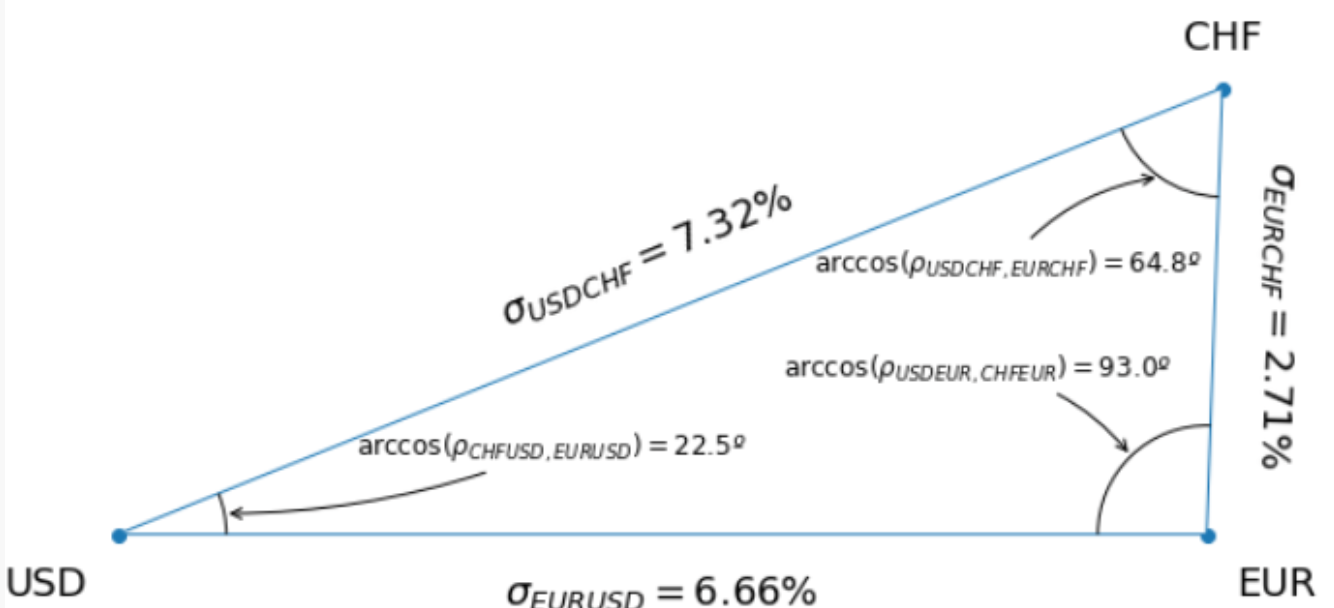
Figure: Example of a currency triangle representation for EUR, CHF, and USD.
In the figure, we can see that EUR and CHF, as European currencies, are closer to each other, reflecting less diversification potential. This means, for example, that CHF would be more attractive to EUR investors with USD exposure compared to USD investors with EUR exposure. In summary, this approach presents information in a concise and interpretable way.
Applications of This Triangular Property in Financial Trading
How can we leverage these triangular properties in financial trading?
Risk Diversification: Observing currency triangles can help us determine correlations and volatilities in a portfolio. If we find that two currencies have high correlation and similar volatility, holding both currencies simultaneously may increase risk. Conversely, if two currencies have low correlation and different volatilities, holding both may reduce risk.
Arbitrage Opportunities: Observing currency triangles can help identify potential arbitrage opportunities. If we find that the volatility of one currency pair is significantly higher than the sum of the volatilities of the other two pairs, there may be an arbitrage opportunity. By buying the low-volatility pair and selling the high-volatility pair, we can capture arbitrage profits.
Exchange Rate Forecasting: Observing currency triangles can provide clues about future exchange rate movements. If we find that the correlation of one currency pair has changed significantly compared to the other two pairs, this may indicate a potential change in the exchange rate. By studying changes in correlation, we can attempt to forecast future exchange rate movements.
It is important to note that this method is just one way to analyze the FX market, and it relies on certain assumptions, such as stable correlation and volatility being additive. In practice, other factors must be considered, and more complex models are needed to analyze market conditions.
References:
[1] Walter, I., & Lopez, J. (2011). The shape of forex forwards. Risk, 24(8), 74-79.