Concepts Related to Normal Distribution
Concepts Related to Normal Distribution
Visit the Mathema Option Pricing System, supporting FX options and structured product pricing and valuation!
In statistics, the normal distribution is a core concept closely related to the standard normal distribution, standard deviation, cumulative distribution function (CDF), percentiles, and quantiles. Below is a detailed explanation of these concepts, including their definitions, mathematical formulas, and applications.
1. Normal Distribution
Definition
The normal distribution is a continuous probability distribution characterized by a symmetric bell-shaped curve. It is widely used to describe the distribution of many random variables in nature (e.g., height, weight, test scores).
Probability Density Function (PDF)
The probability density function of the normal distribution is:
- : Mean, determining the center of the distribution.
- : Standard deviation, measuring the dispersion of data and determining the width of the curve.
- : Value of the random variable.
Characteristics
- Symmetry: The distribution is symmetric about the mean .
- Peak: The maximum value of the PDF occurs at the mean .
- Tails: The tails of the distribution asymptotically approach zero (but never reach zero).
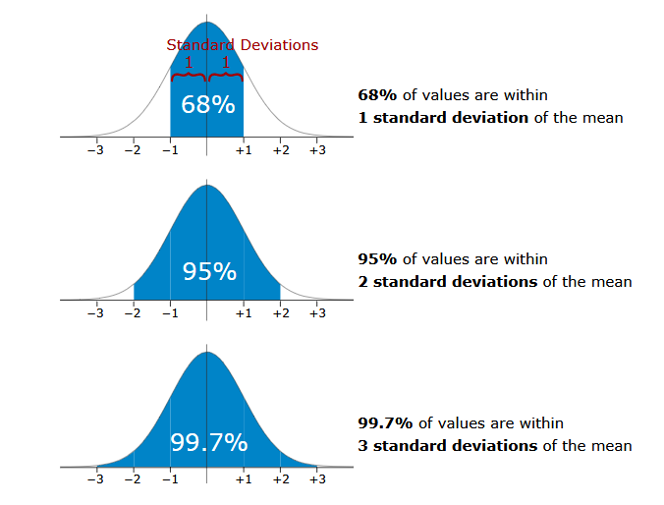
- 68-95-99.7 Rule:
- 68% of the data lies within .
- 95% of the data lies within .
- 99.7% of the data lies within .
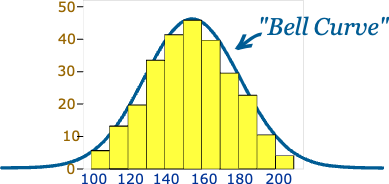
Histogram Interpretation of Normal Distribution
- A histogram is a bar chart that divides data into intervals, used to visualize data distribution.
- If a dataset follows a normal distribution, its histogram will show a symmetric bell shape, with data concentrated around the mean and tapering off on both sides.
Example: For a dataset with mean and standard deviation , the histogram might look like this:

2. Standard Normal Distribution
Definition
The standard normal distribution is a special case of the normal distribution with the following parameters:
- Mean
- Standard deviation

Probability Density Function (PDF)
The PDF of the standard normal distribution is:
Characteristics
- The distribution is centered at 0.
- The standard normal distribution serves as a reference for all normal distributions and can be obtained by standardizing any normal distribution.
Standardization Formula
To convert any normal distribution to a standard normal distribution:
- : Standardized value (also called the Z-score).
- : Original data value.
- : Mean.
- : Standard deviation.
3. Standard Deviation ()
Definition
The standard deviation measures the dispersion of data, indicating how far data points deviate from the mean on average.
Formula
The standard deviation is the square root of the variance:
- : Mean of the data.
- : The -th data point.
Significance in Normal Distribution
- The standard deviation determines the width of the normal distribution curve.
- A smaller standard deviation indicates data is more concentrated, resulting in a narrower curve.
- A larger standard deviation indicates data is more spread out, resulting in a wider curve.
4. Relationship Between Normal Distribution and Standard Deviation
The center of the normal distribution is the mean (), and its spread is determined by the standard deviation (). The figure below illustrates the three intervals of the normal distribution, each covering a specific probability range:

68% of Data Within ±1 Standard Deviation
- Range:
- This means:
- 68% of the data lies within 1 standard deviation of the mean.
- For example, if and , 68% of the data lies within .
95% of Data Within ±2 Standard Deviations
- Range:
- This means:
- 95% of the data lies within 2 standard deviations of the mean.
- For example, if and , 95% of the data lies within .
99.7% of Data Within ±3 Standard Deviations
- Range:
- This means:
- 99.7% of the data lies within 3 standard deviations of the mean.
- For example, if and , 99.7% of the data lies within .
Interpretation of the Figure
Middle 68% (±1σ):
- Represents the majority of data concentrated around the mean.
- 68% probability indicates that most data points are close to the mean.
Extended to ±2σ (95%):
- Covers a wider range of data.
- Indicates that extreme values (far from the mean) are rare in a normal distribution.
Extended to ±3σ (99.7%):
- Includes almost all data points (99.7%).
- The remaining 0.3% represents extreme outliers.
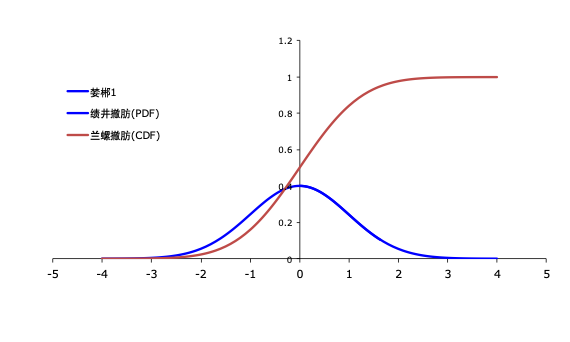
5. Cumulative Distribution Function (CDF)
Definition
The cumulative distribution function (CDF) describes the probability that a random variable is less than or equal to a value :

Significance in Normal Distribution
- The CDF is the integral of the normal distribution's PDF.
- It represents the probability of the area under the curve to the left of a given value.
- In the standard normal distribution, the CDF is often denoted by .
Example
- : The cumulative probability at the mean is 50%.
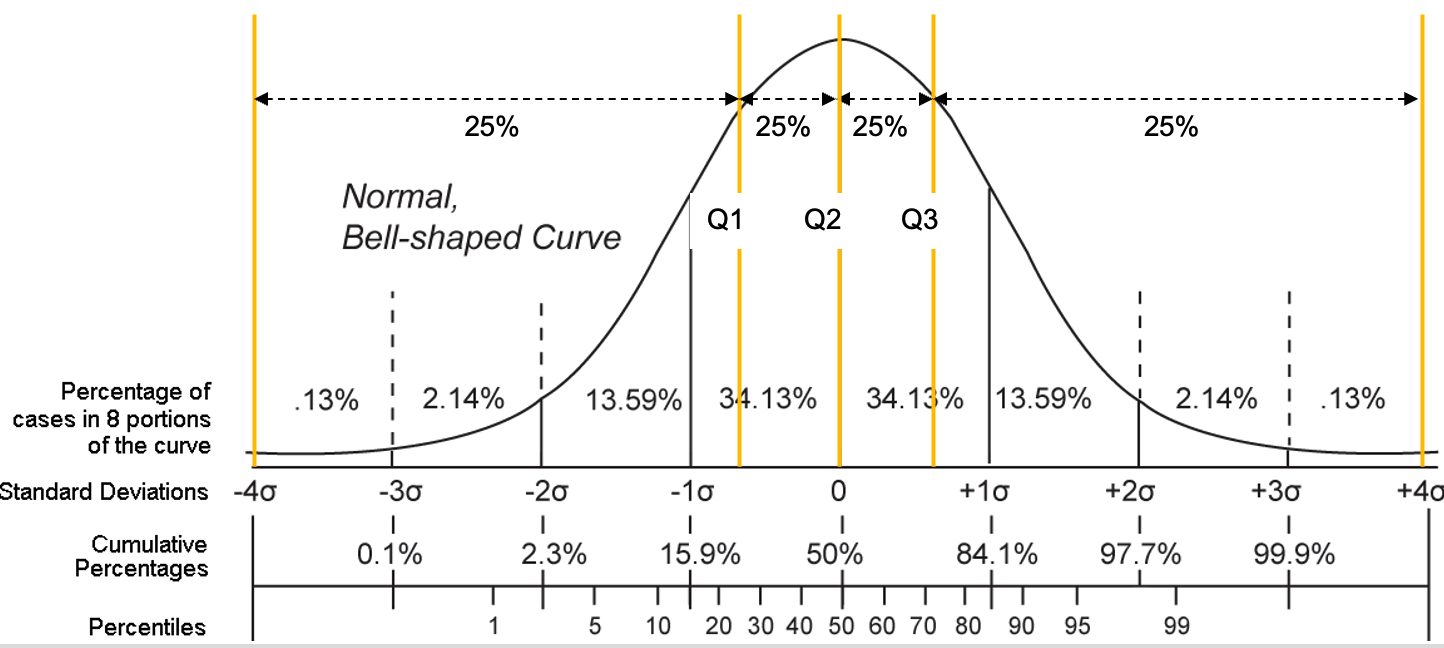
- : In the standard normal distribution, the probability of a value less than is approximately 15.87%.
6. Percentiles
Definition
A percentile divides a data distribution into 100 equal parts, indicating the relative position of a value within the distribution.
Formula
The -th percentile is the value below which of the data falls.
Examples:
- 25th Percentile (P25): 25% of the data is less than or equal to this value (also called the first quartile, Q1).
- 50th Percentile (P50): 50% of the data is less than or equal to this value (equivalent to the median).
- 75th Percentile (P75): 75% of the data is less than or equal to this value (also called the third quartile, Q3).
7. Quantiles
Definition
A quantile divides a data distribution into equal-sized intervals, generalizing the concept of percentiles.
Formula
Quantiles are defined by a proportion . For example:
- : The 0.25 quantile (or 25th percentile).
- : The 0.5 quantile (or median).
Relationship Between Quantiles and Percentiles
Percentiles are a specific case of quantiles:
Examples:
- 0.25 quantile = 25th percentile.
- 0.75 quantile = 75th percentile.

8. Summary and Comparison
| Concept | Definition | Formula/Characteristics |
|---|---|---|
| Normal Distribution | A continuous probability distribution with a symmetric bell-shaped curve, determined by mean and standard deviation . | |
| Standard Normal Distribution | A special normal distribution with and . | |
| Standard Deviation | Measures the dispersion of data, indicating how far data points deviate from the mean. | |
| Cumulative Distribution Function (CDF) | Represents the probability that a random variable is less than or equal to a value . | |
| Percentile | Divides data distribution into 100 equal parts, indicating the relative position of a value. | |
| Quantile | Divides data distribution into equal-sized intervals, generalizing percentiles. |
9. Applications
- Normal Distribution: Used to describe natural phenomena (e.g., height, weight).
- Standard Normal Distribution: Used in probability calculations and hypothesis testing.
- Standard Deviation: Measures data variability (e.g., stock returns volatility).
- Cumulative Distribution Function (CDF): Calculates probabilities and plots distribution curves.
- Percentiles and Quantiles: Describe data distribution, especially in skewed distributions (e.g., income distribution, test scores).
