Volatility Surface Construction - Validation Logic Explanation
Volatility Surface Construction - Validation Logic Explanation
Shanghai Meridian Digital Technology Co., Ltd., Mathmema Options Team
March 7, 2025
Preface
The construction of volatility surfaces is influenced by various factors. Different tools employ different models and adhere to their own market conventions. These factors include:
- Smile Interpolation Method: Such as cubic, linear, SVI, SABR, etc., covering both interpolation and extrapolation.
- Smile Interpolation Space: Based on strike, log-moneyness, or delta.
- Time Interpolation: The treatment along the time dimension.
- Market Conventions:
- ATM Convention: ATM Forward, DNS (Delta Neutral Straddle), ATM Spot.
- Delta Convention: Forward Delta, Spot Delta.
- Premium Adjusted: Whether to adjust for the option premium (Yes/No).
Inconsistencies in any of the above parameters can lead to differences in the constructed results.
Purpose
This test aims to verify that the volatility surface we construct is accurate and meets the expected requirements.
Validation Method
The Bloomberg system provides rich market data, including raw spot prices, interest rate data, forward points data, and volatilities published in the form of ATM, RR (Risk Reversal), and BF (Butterfly). Furthermore, the Bloomberg system has a calibration function; it constructs a volatility surface using its internal model and outputs the following results:
- A wider range of Delta points (e.g., 5, 10, 15, 25, 35, ATM, etc.);
- The Strike corresponding to each Delta;
- The Volatility corresponding to each Strike.
Our validation logic is as follows:
- Data and Convention Consistency:
- Use the raw data provided by Bloomberg.
- Ensure consistency with the Conventions used by Bloomberg (e.g., ATM definition, Delta definition, etc.).
- Result Verification:
- Construct the volatility surface based on the aforementioned data.
- Obtain the Strike and Volatility for the corresponding Deltas.
- Compare the results with the output from Bloomberg's calibration to ensure consistency in Strike and Volatility.
Testing and Conclusion
We selected two sets of data from the Bloomberg system for comparative validation:
- Data Dates: March 5, 2025, and June 5, 2023.
Comparison Results
- Within 10 Delta: The Strike and Volatility are basically consistent with the Bloomberg results.
- Beyond 10 Delta: The Strike and Volatility show slight differences compared to the Bloomberg results.
Conclusion
Based on the above comparison, we conclude that:
- Our methodology and logic for volatility surface construction meet industry requirements.
- The results are highly consistent with international conventions (using Bloomberg as the benchmark), validating the accuracy of our construction process.
Raw Data (Bloomberg)
Taking March 5, 2025, as an example:
Spot Price
Spot: 7.2605
Interest Rate Curve and Forward Curve
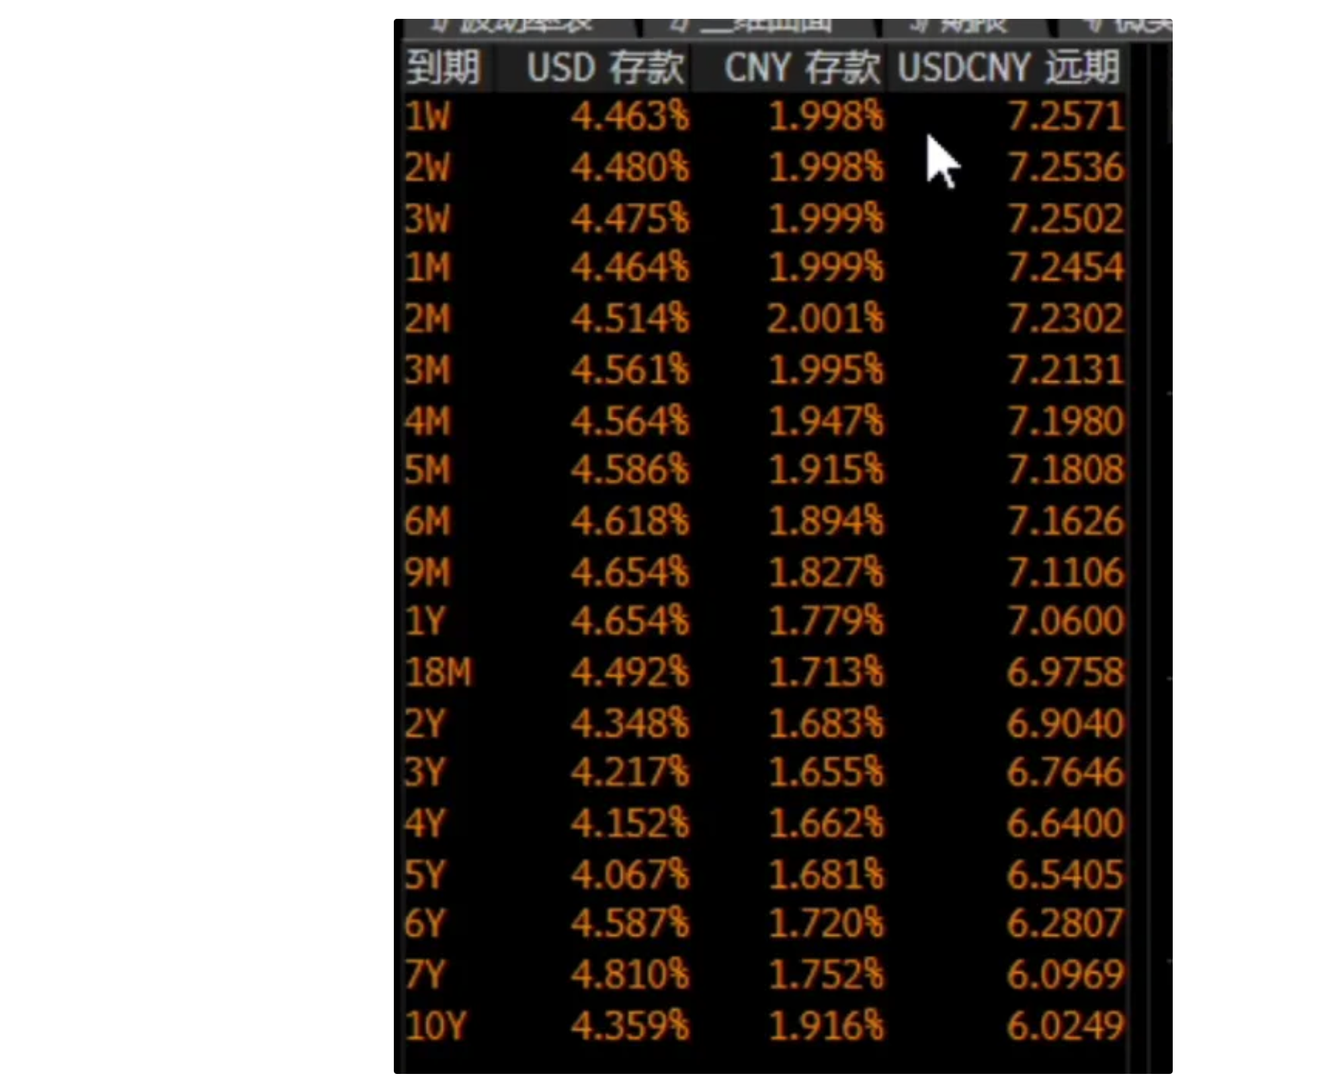
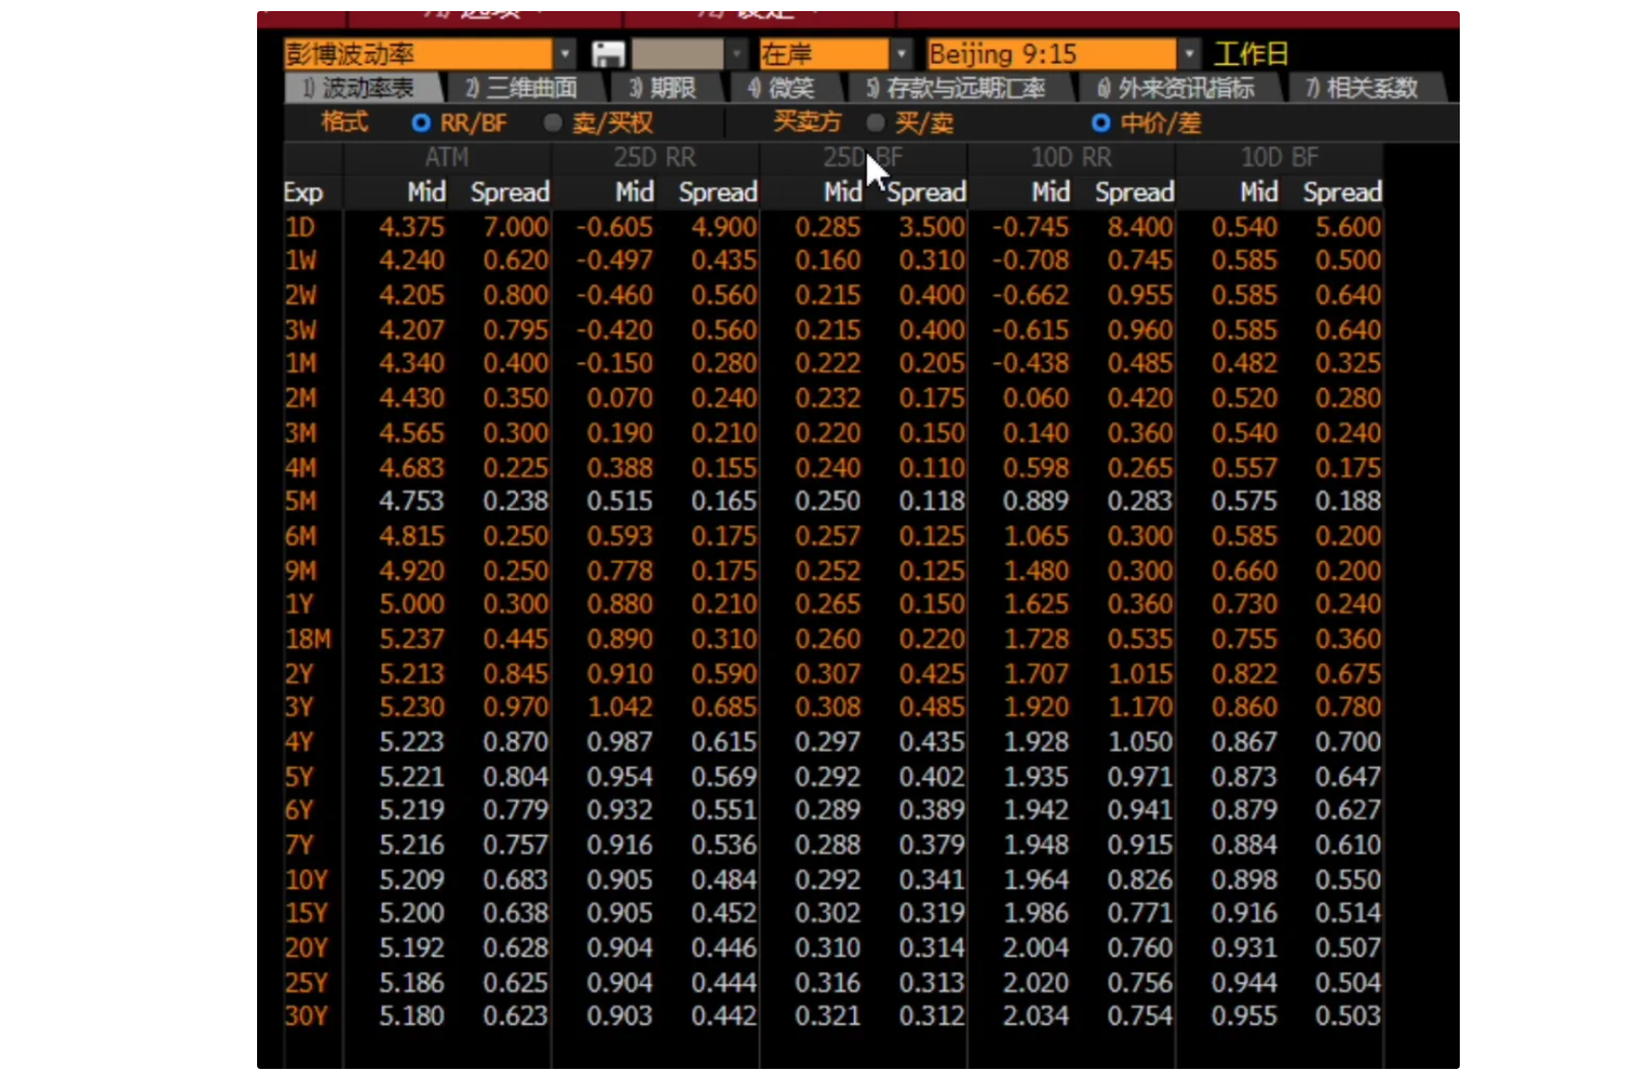
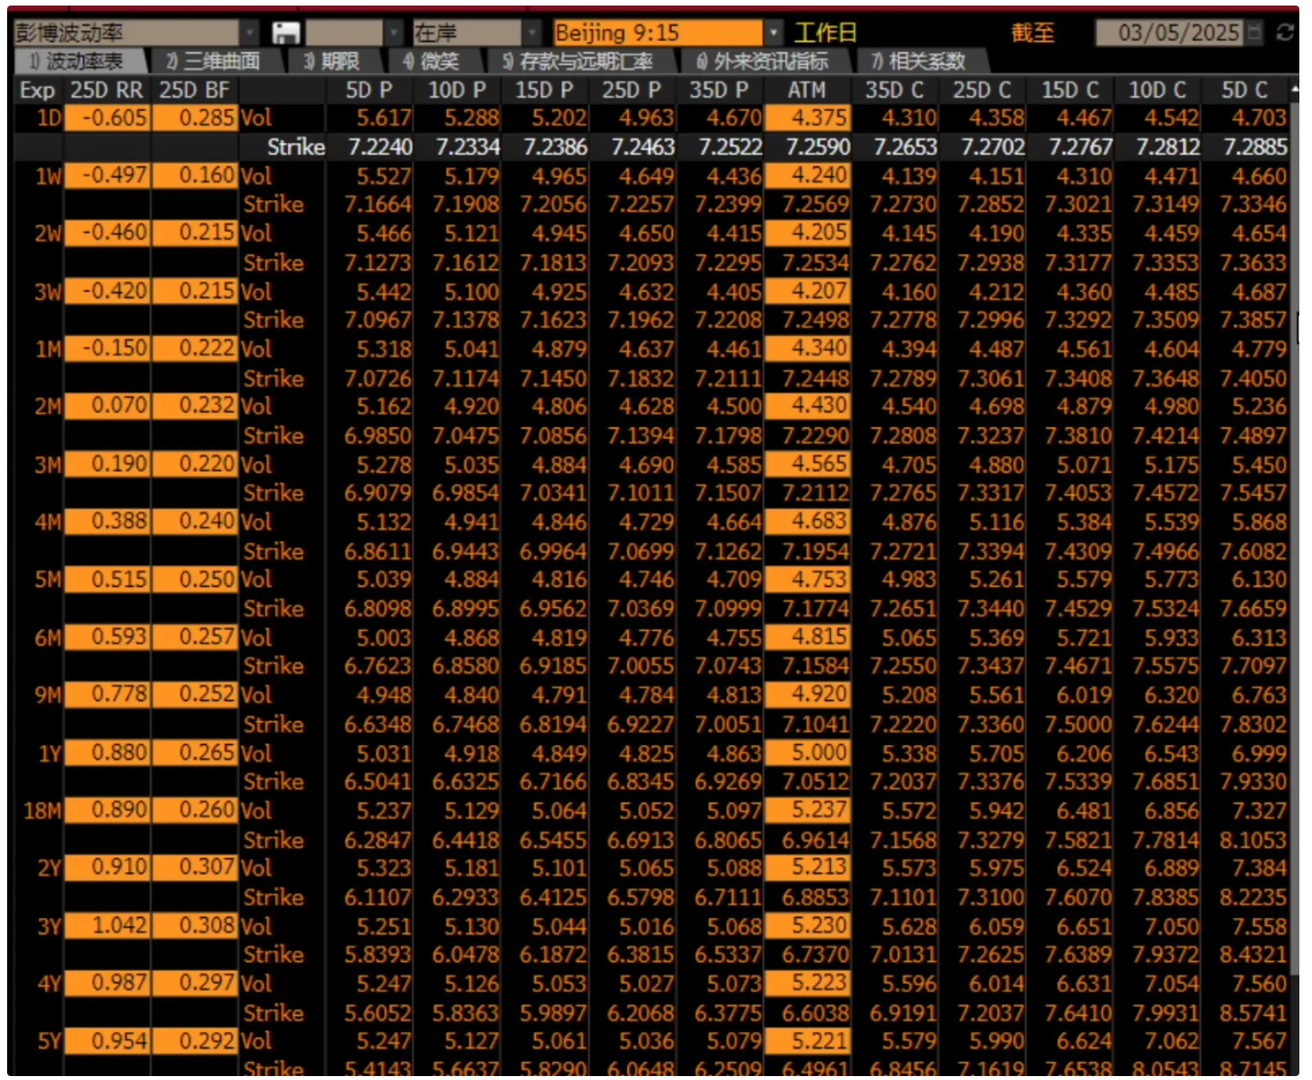
Volatility Data
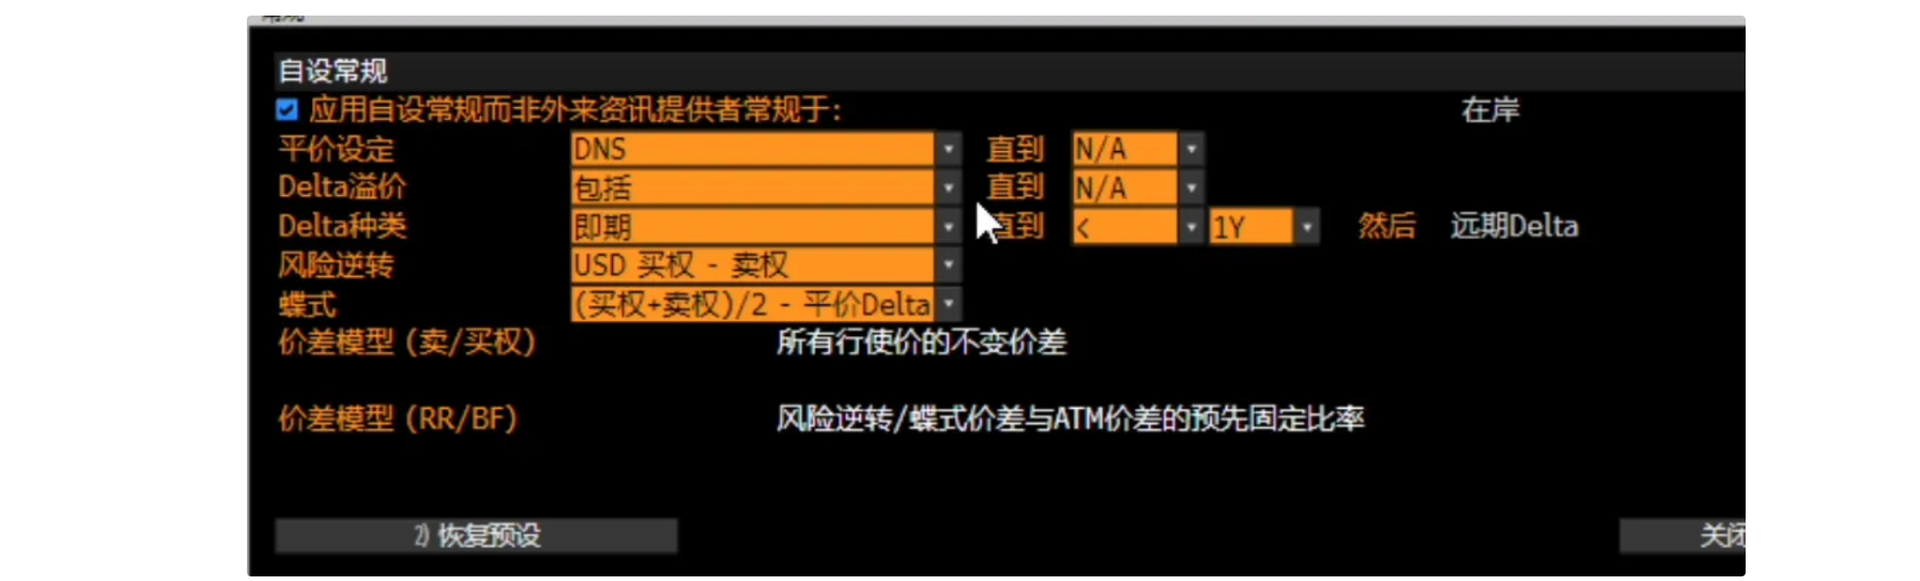
Conventions for Volatility Data
Summary:
- ATM Convention: DNS
- Premium Adjusted: Yes
- Delta Convention: Spot Delta (for tenors below 1 year), Forward Delta (for 1 year and above)
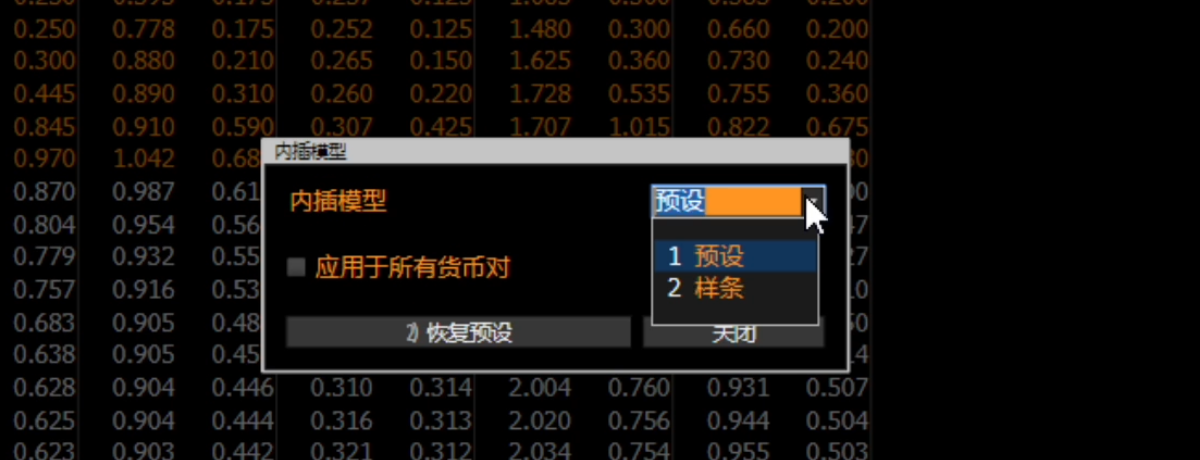
Volatility Interpolation
Interpolation Method: Preset (Uncertain which specific interpolation method is used)
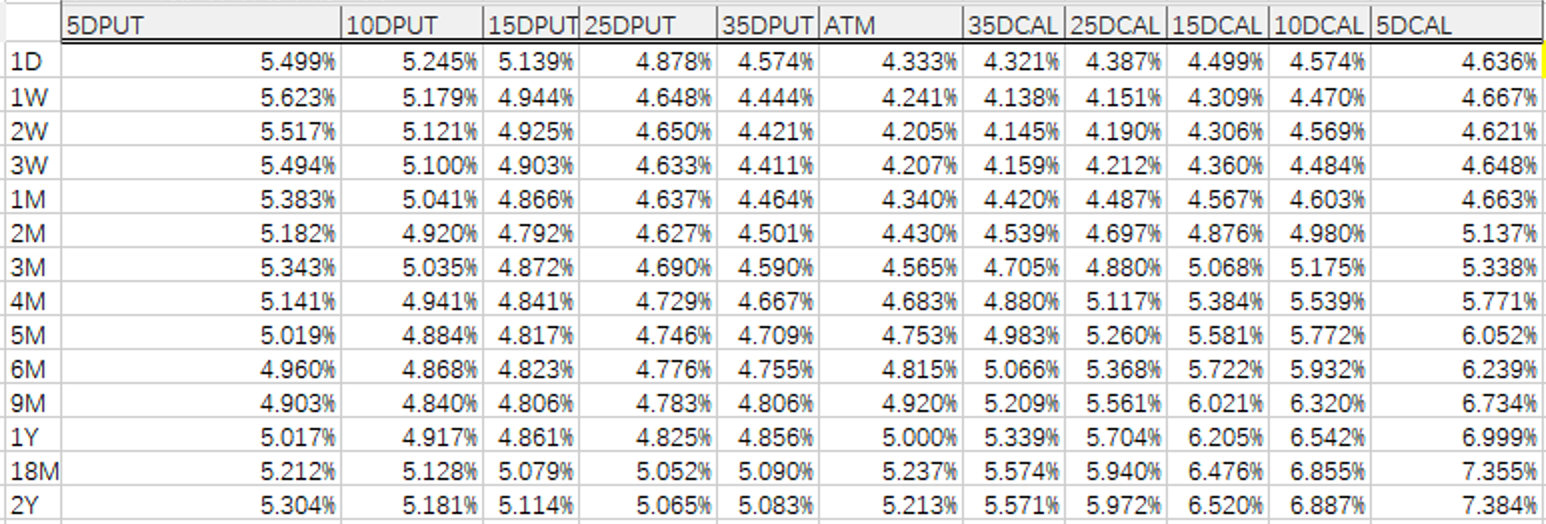
Calibrated Volatilities (Bloomberg)
The volatilities after Bloomberg calibration (effectively the calculated volatility surface results), include the calculated strikes, more delta points, etc.
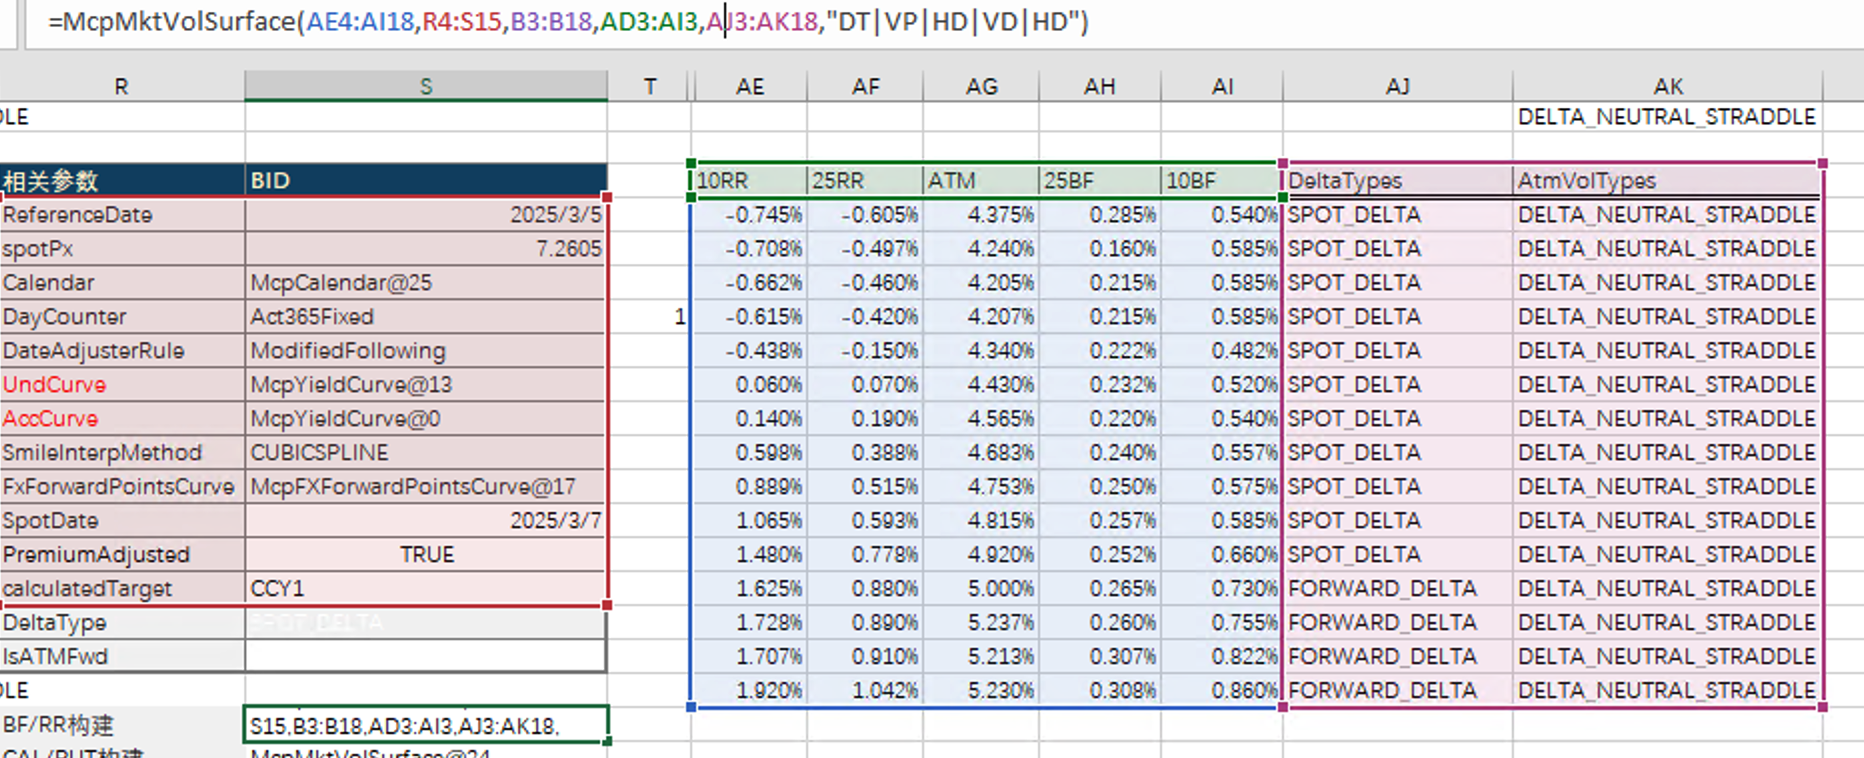
Our Validation Process
Constructing the Volatility Surface
Using market data and conventions identical to Bloomberg, as shown below:
Volatility Calibration
Generate the corresponding strikes and volatilities according to the deltas (5D PUT, 10D PUT, 15D PUT, 25D PUT, 35D PUT, ATM, 35D CALL, 25D CALL, 15D CALL, 10D CALL, 5D CALL) and their corresponding tenors.
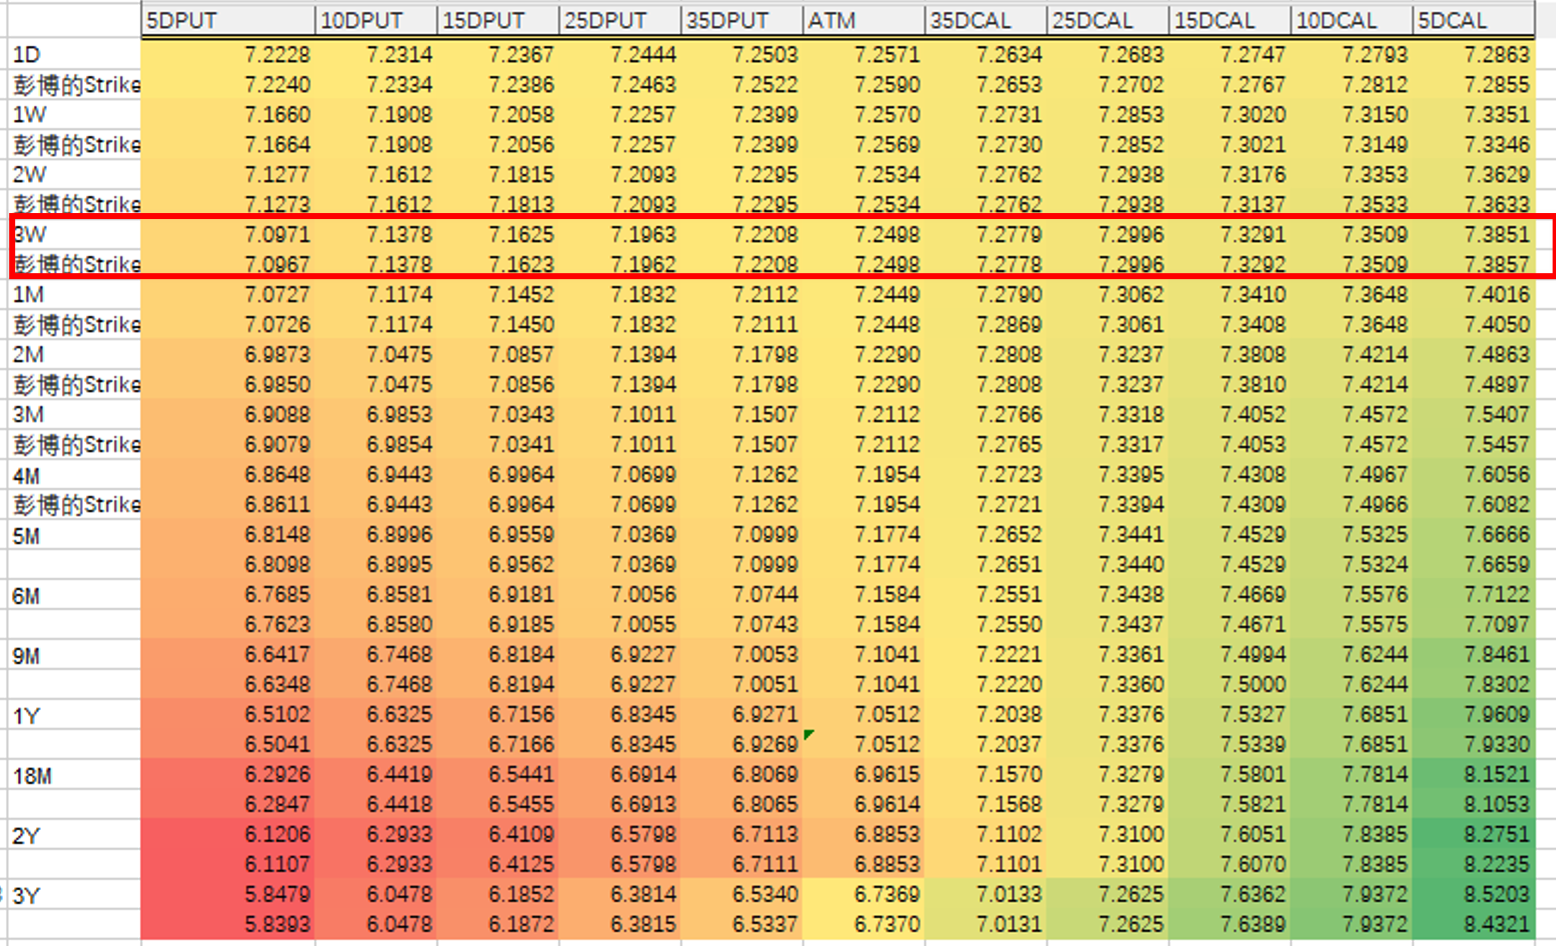
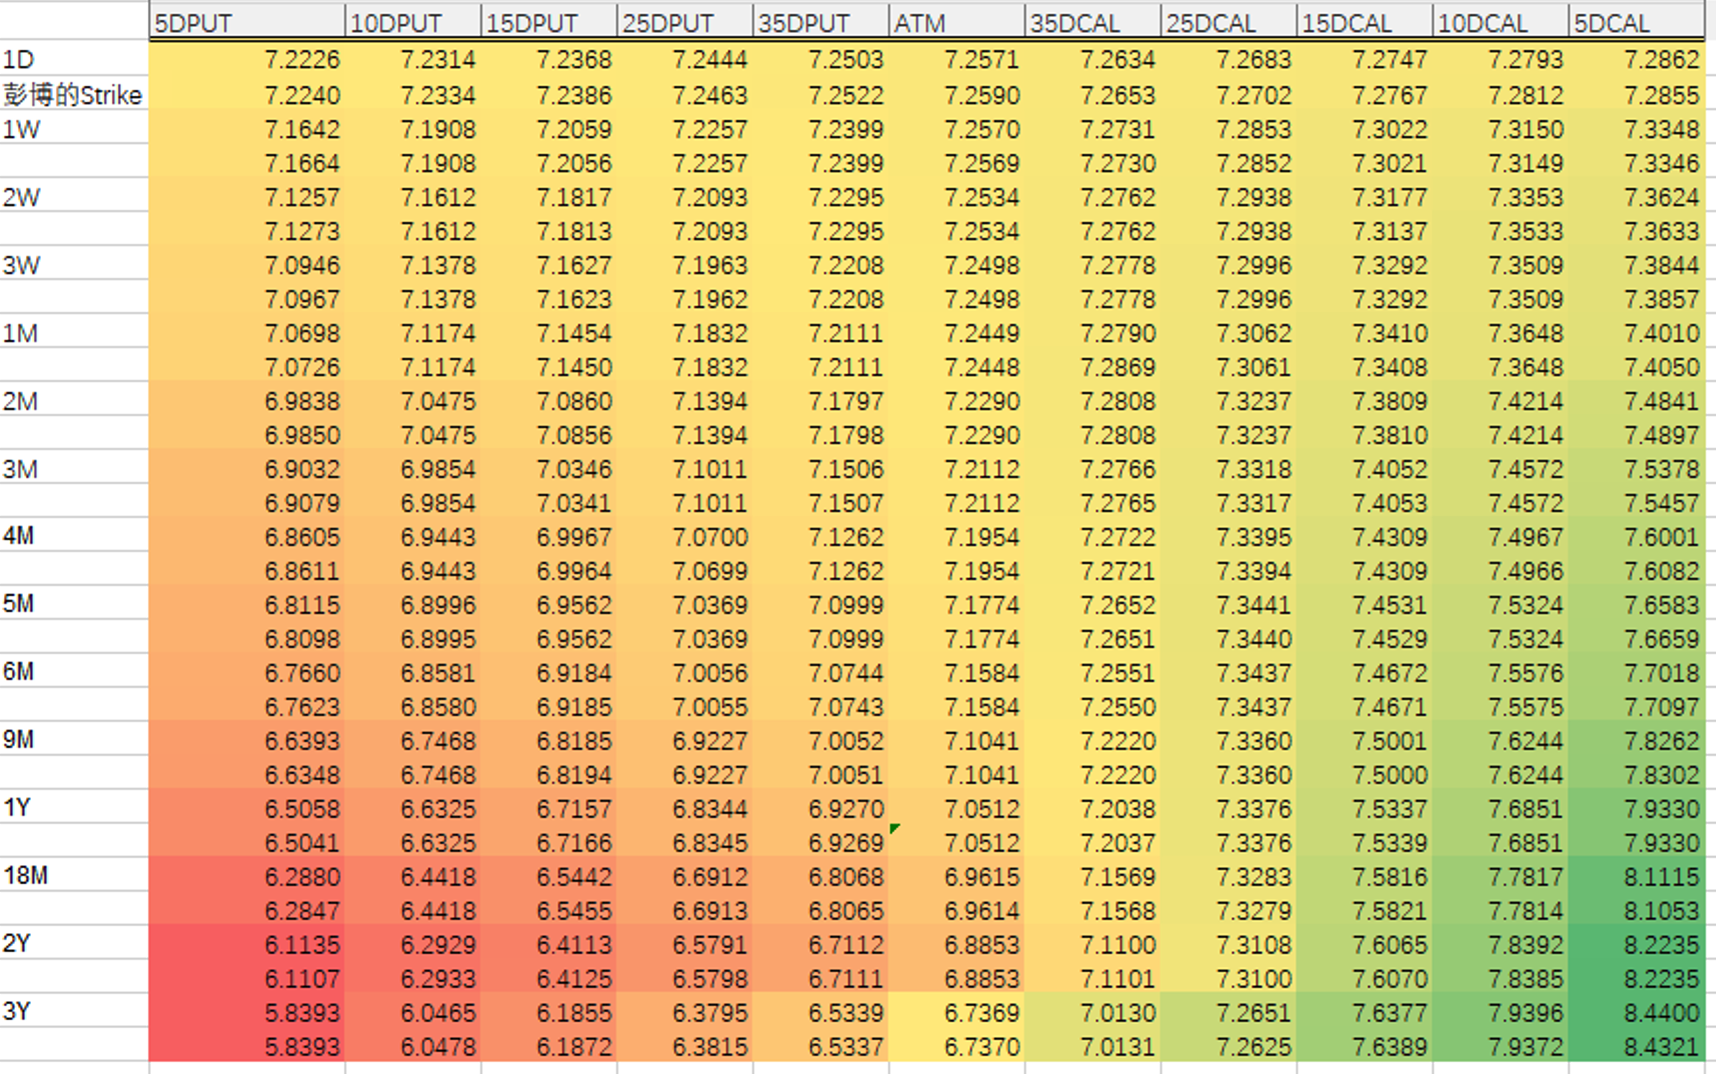
Strike Comparison
The following compares the strikes first. Conclusion:
- Strikes within 10 Delta are basically consistent, with a total error of 0.071 (across 9x15 data points).
- Differences for strikes beyond 10 Delta are slightly larger. The total error (including both within and beyond 10D) is 0.382 (across 11x15 data points).
Explanation: The extrapolation method used by Bloomberg is uncertain. Our extrapolation method is linear.
- The error for 1D is slightly larger.
Explanation: Bloomberg does not provide 1D forward prices. The deviation in forward price calculation leads to a slightly larger error.
Volatility Comparison
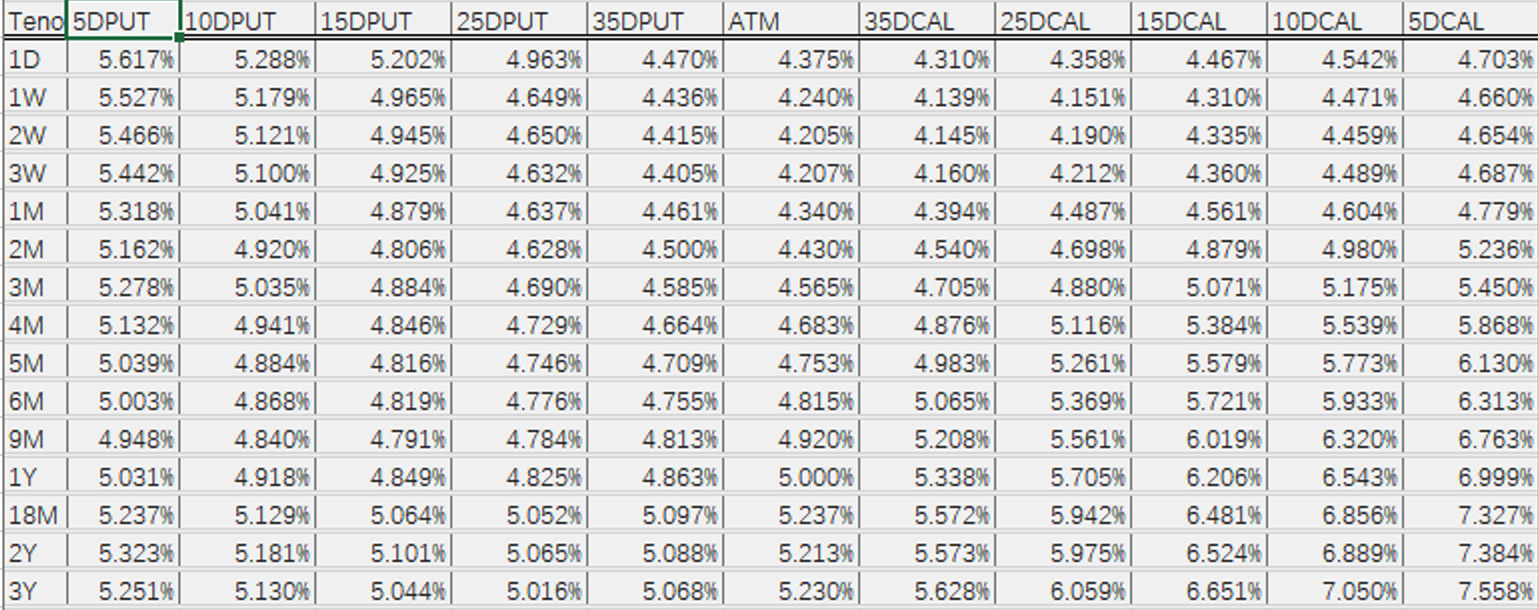
Bloomberg Volatilities:
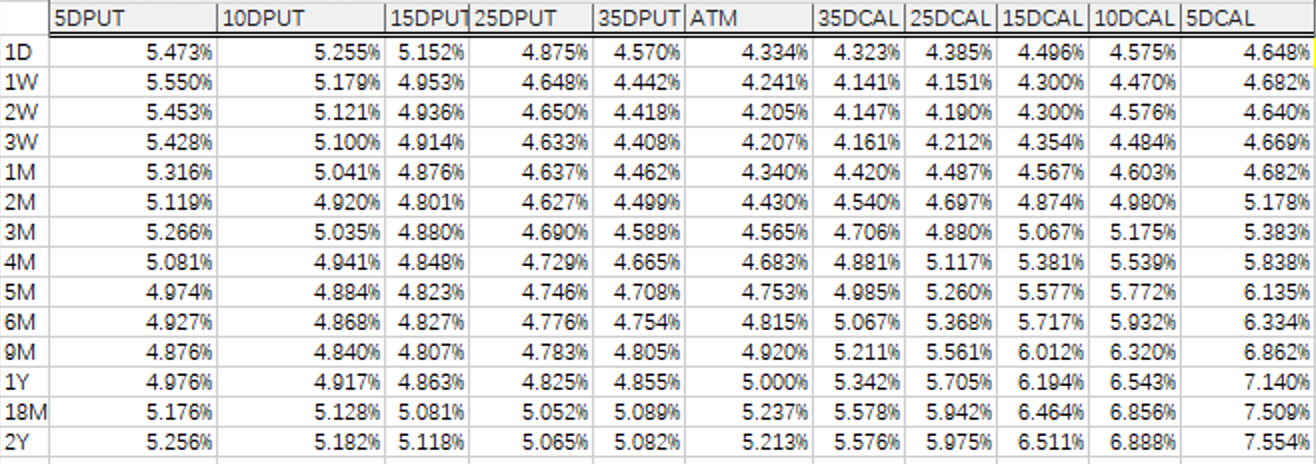
MCP (Mammoth) Calculated Volatilities:
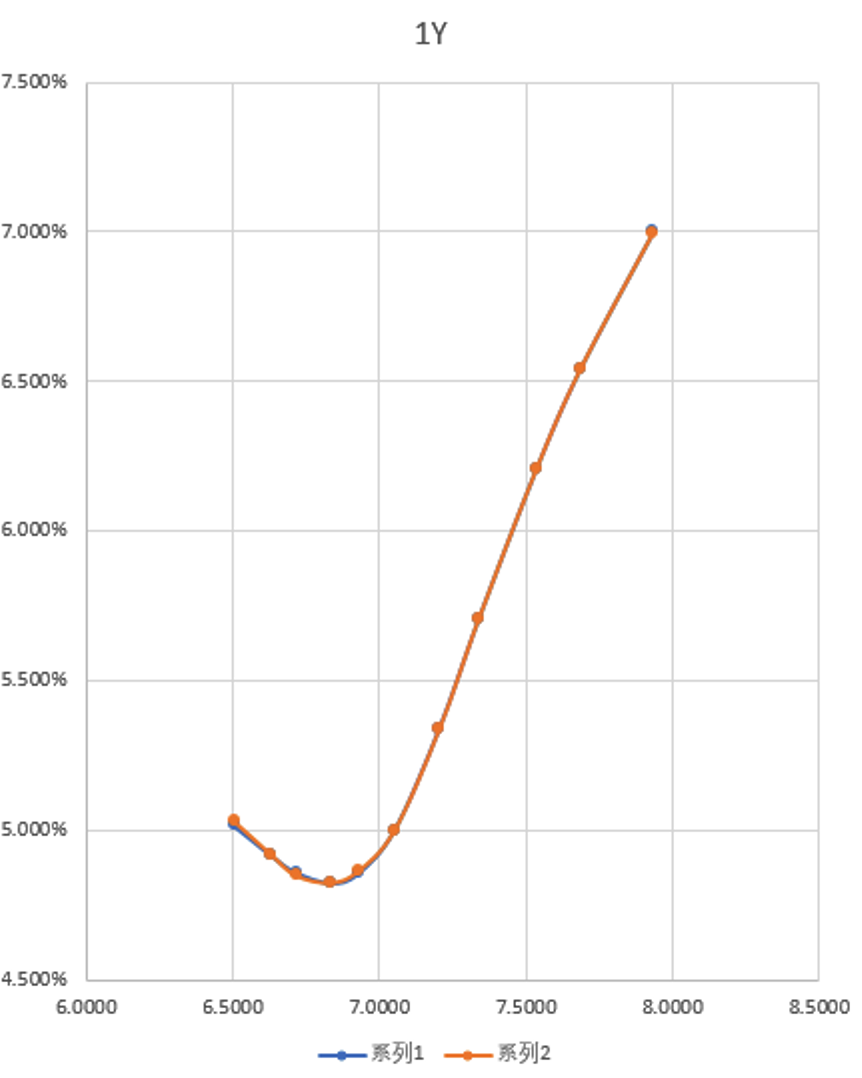
Comparison Conclusion
- Slight difference for 1D.
The raw Bloomberg data lacks 1D forward prices.
- Small differences within 10D.
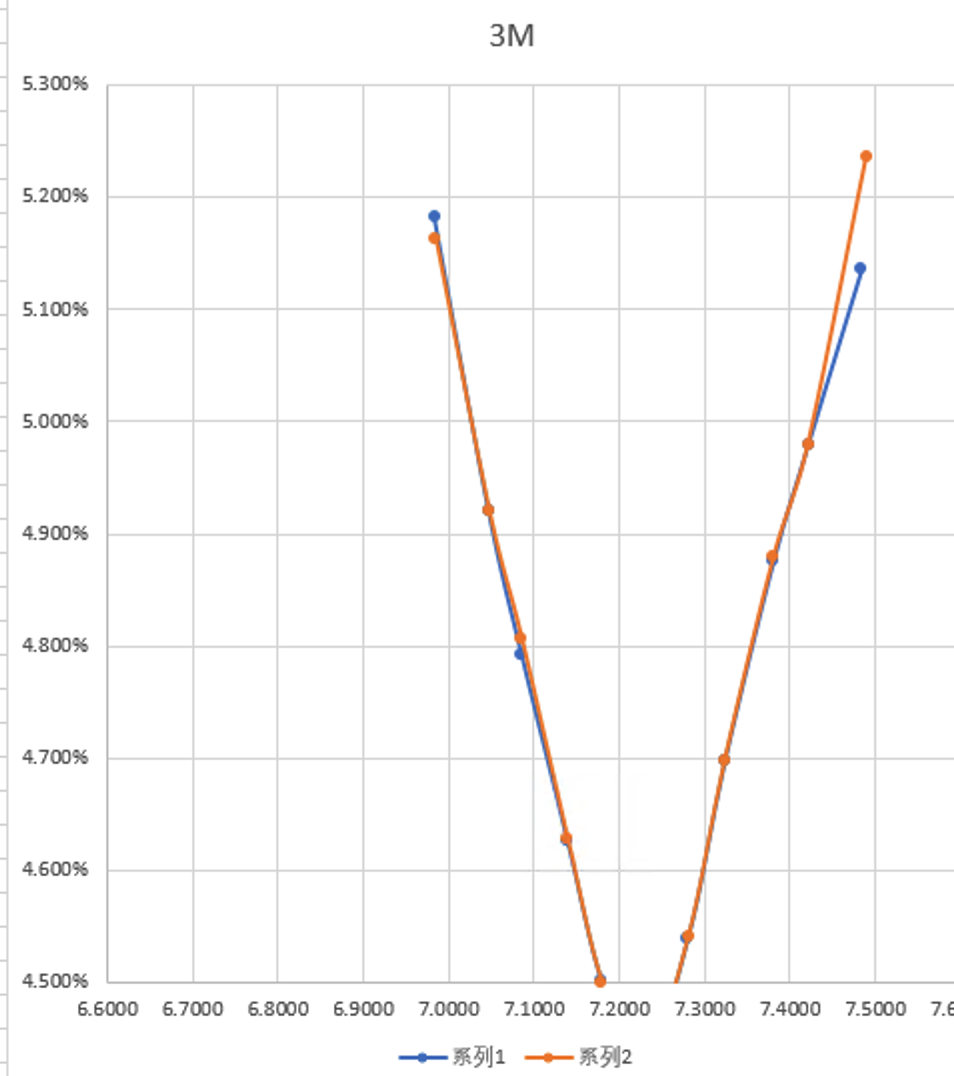
- Slightly more noticeable differences beyond 10D.
Again due to the linear extrapolation method.
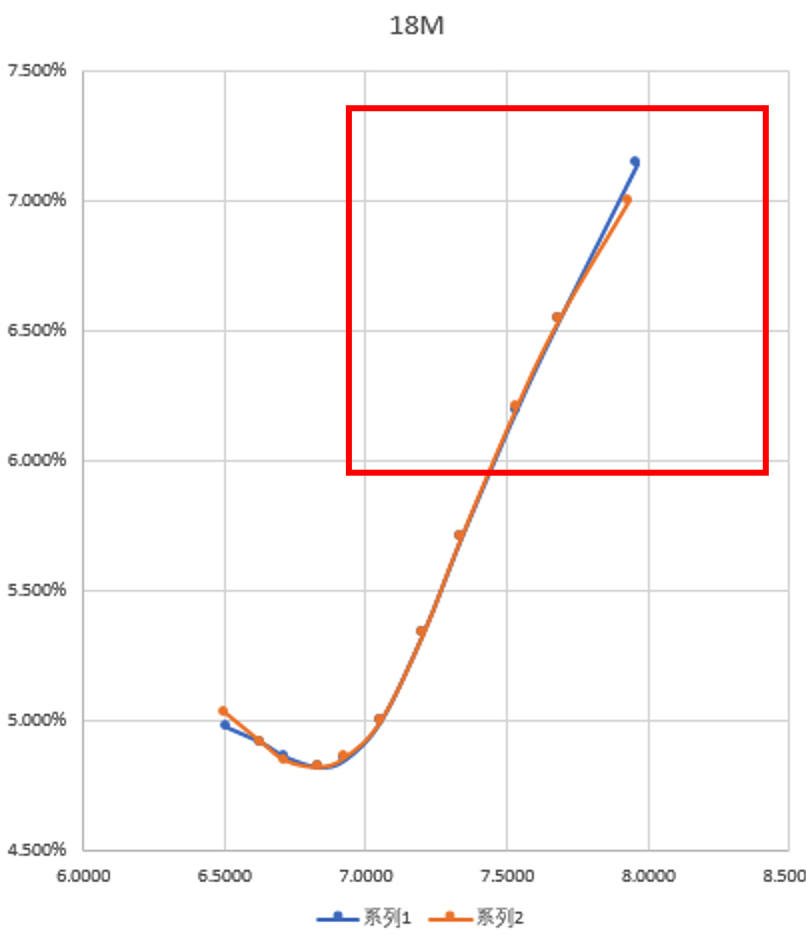
As seen in the 1Y chart below (Note: the label on the chart is incorrect, it should be 1Y), the blue line (MCP calculation) maintains linear extrapolation.
Attachments
- Volatility Surface Construction - Validation Logic Explanation 0306 - Meridian.xlsx
Optimization Plan for Tail Volatility (2025/3/14)
Purpose and Current Status (CUBICSPLINE + LINEAR EXPLORATION)
Address the interpolation or fitting issues for data beyond 10 Delta.
According to the test case above, using the previous smile curve construction logic (CUBICSPLINE + LINEAR EXPLORATION), the comparison data is as follows:
| Strike Back-Calculation Results | Total Deviation within 10D | Total Deviation including 5D |
|---|---|---|
| 0.0536 | 0.3587 | |
| Volatility Interpolation Results | 0.49885% | 1.974% |
| Avg Deviation: 0.000168075 Max Deviation: 0.001819134 Min Deviation: 1.64778E-09 |
Goal: Improve the accuracy of extrapolation beyond 10 Delta.
Optimization Methods and Conclusion
After comparing various methods (CUBICSPLINE extrapolation, SABR+CUBICSPLINE, Wing Parameterization), our conclusion is:
- Both SABR+CUBICSPLINE and Wing Parameterization methods handle the tails better than the current scheme (CUBIC+LINEAR).
- The Wing Parameterization method yields the best results. The logic of this method is: set a "wing ratio" parameter, which is determined through calibration or based on traders' market experience, to adjust the tail volatilities.
Test Results (Wing Parameterization)
| Strike Back-Calculation Results | Total Deviation within 10D | Total Deviation including 5D |
|---|---|---|
| 0.058 | 0.153 | |
| Volatility Interpolation Results | 0.464543% | 1.702% |
| Avg Deviation: 0.000171078 Max Deviation: 0.001945885 Min Deviation: 1.30545E-08 |
Specific Test Data
Strike Comparison
Volatility Comparison
Bloomberg Volatilities
MCP (Mammoth) Calculated Volatilities:
1Y Comparison Chart
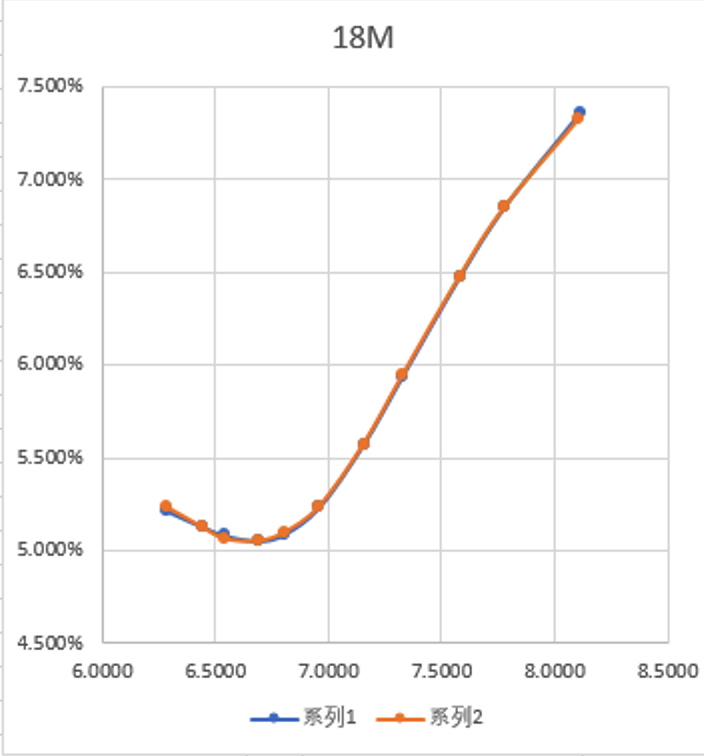
18-Month Chart
3-Month Chart